How to Debug Your JSON Code?
As a developer, you know that debugging is a crucial part of the programming process. When it comes to JSON code, debugging can be especially challenging because the errors are not always obvious. However, with the right tools and techniques, you can easily identify and fix errors in your JSON code.
What is JSON Debugging and How Does it Work?
JSON (JavaScript Object Notation) is a lightweight data interchange format. Debugging JSON code involves identifying and fixing errors in the syntax or structure of the data exchange. JSON debugging typically involves following a set of steps to identify and fix the errors in the data exchange.
You can use different methods to debug JSON code, such as online tools, built-in functions, or third-party libraries. Some popular tools include browser developer tools, IDEs, and JSON validators.
Scenarios for Developers
Debugging JSON code is an essential skill for developers. Here are some scenarios where debugging JSON code may come in handy:
- You are building an API that returns JSON data, but the data is not formatted correctly, causing errors when parsed.
- You are consuming JSON data from an external source, but the data is not in the correct format, resulting in errors.
- You need to update or modify JSON data, but the changes are causing syntax errors.
Key Features of JSON Debugging
Here are some key features of JSON debugging that can make your debugging process more efficient:
| Feature | Description |
|---|---|
| Code Validation | The process of verifying if the code conforms to a predetermined set of rules. |
| Syntax Error Detection | Identifying errors in the structure, format, or syntax of the JSON. |
| JSON Parsers | Programs that parse or convert JSON strings into objects for easier manipulation. |
| Data Visualization | Tools that display JSON data in a structured and readable format. |
| Debugging Tools | Tools that help identify errors and trace the data flow through the code. |
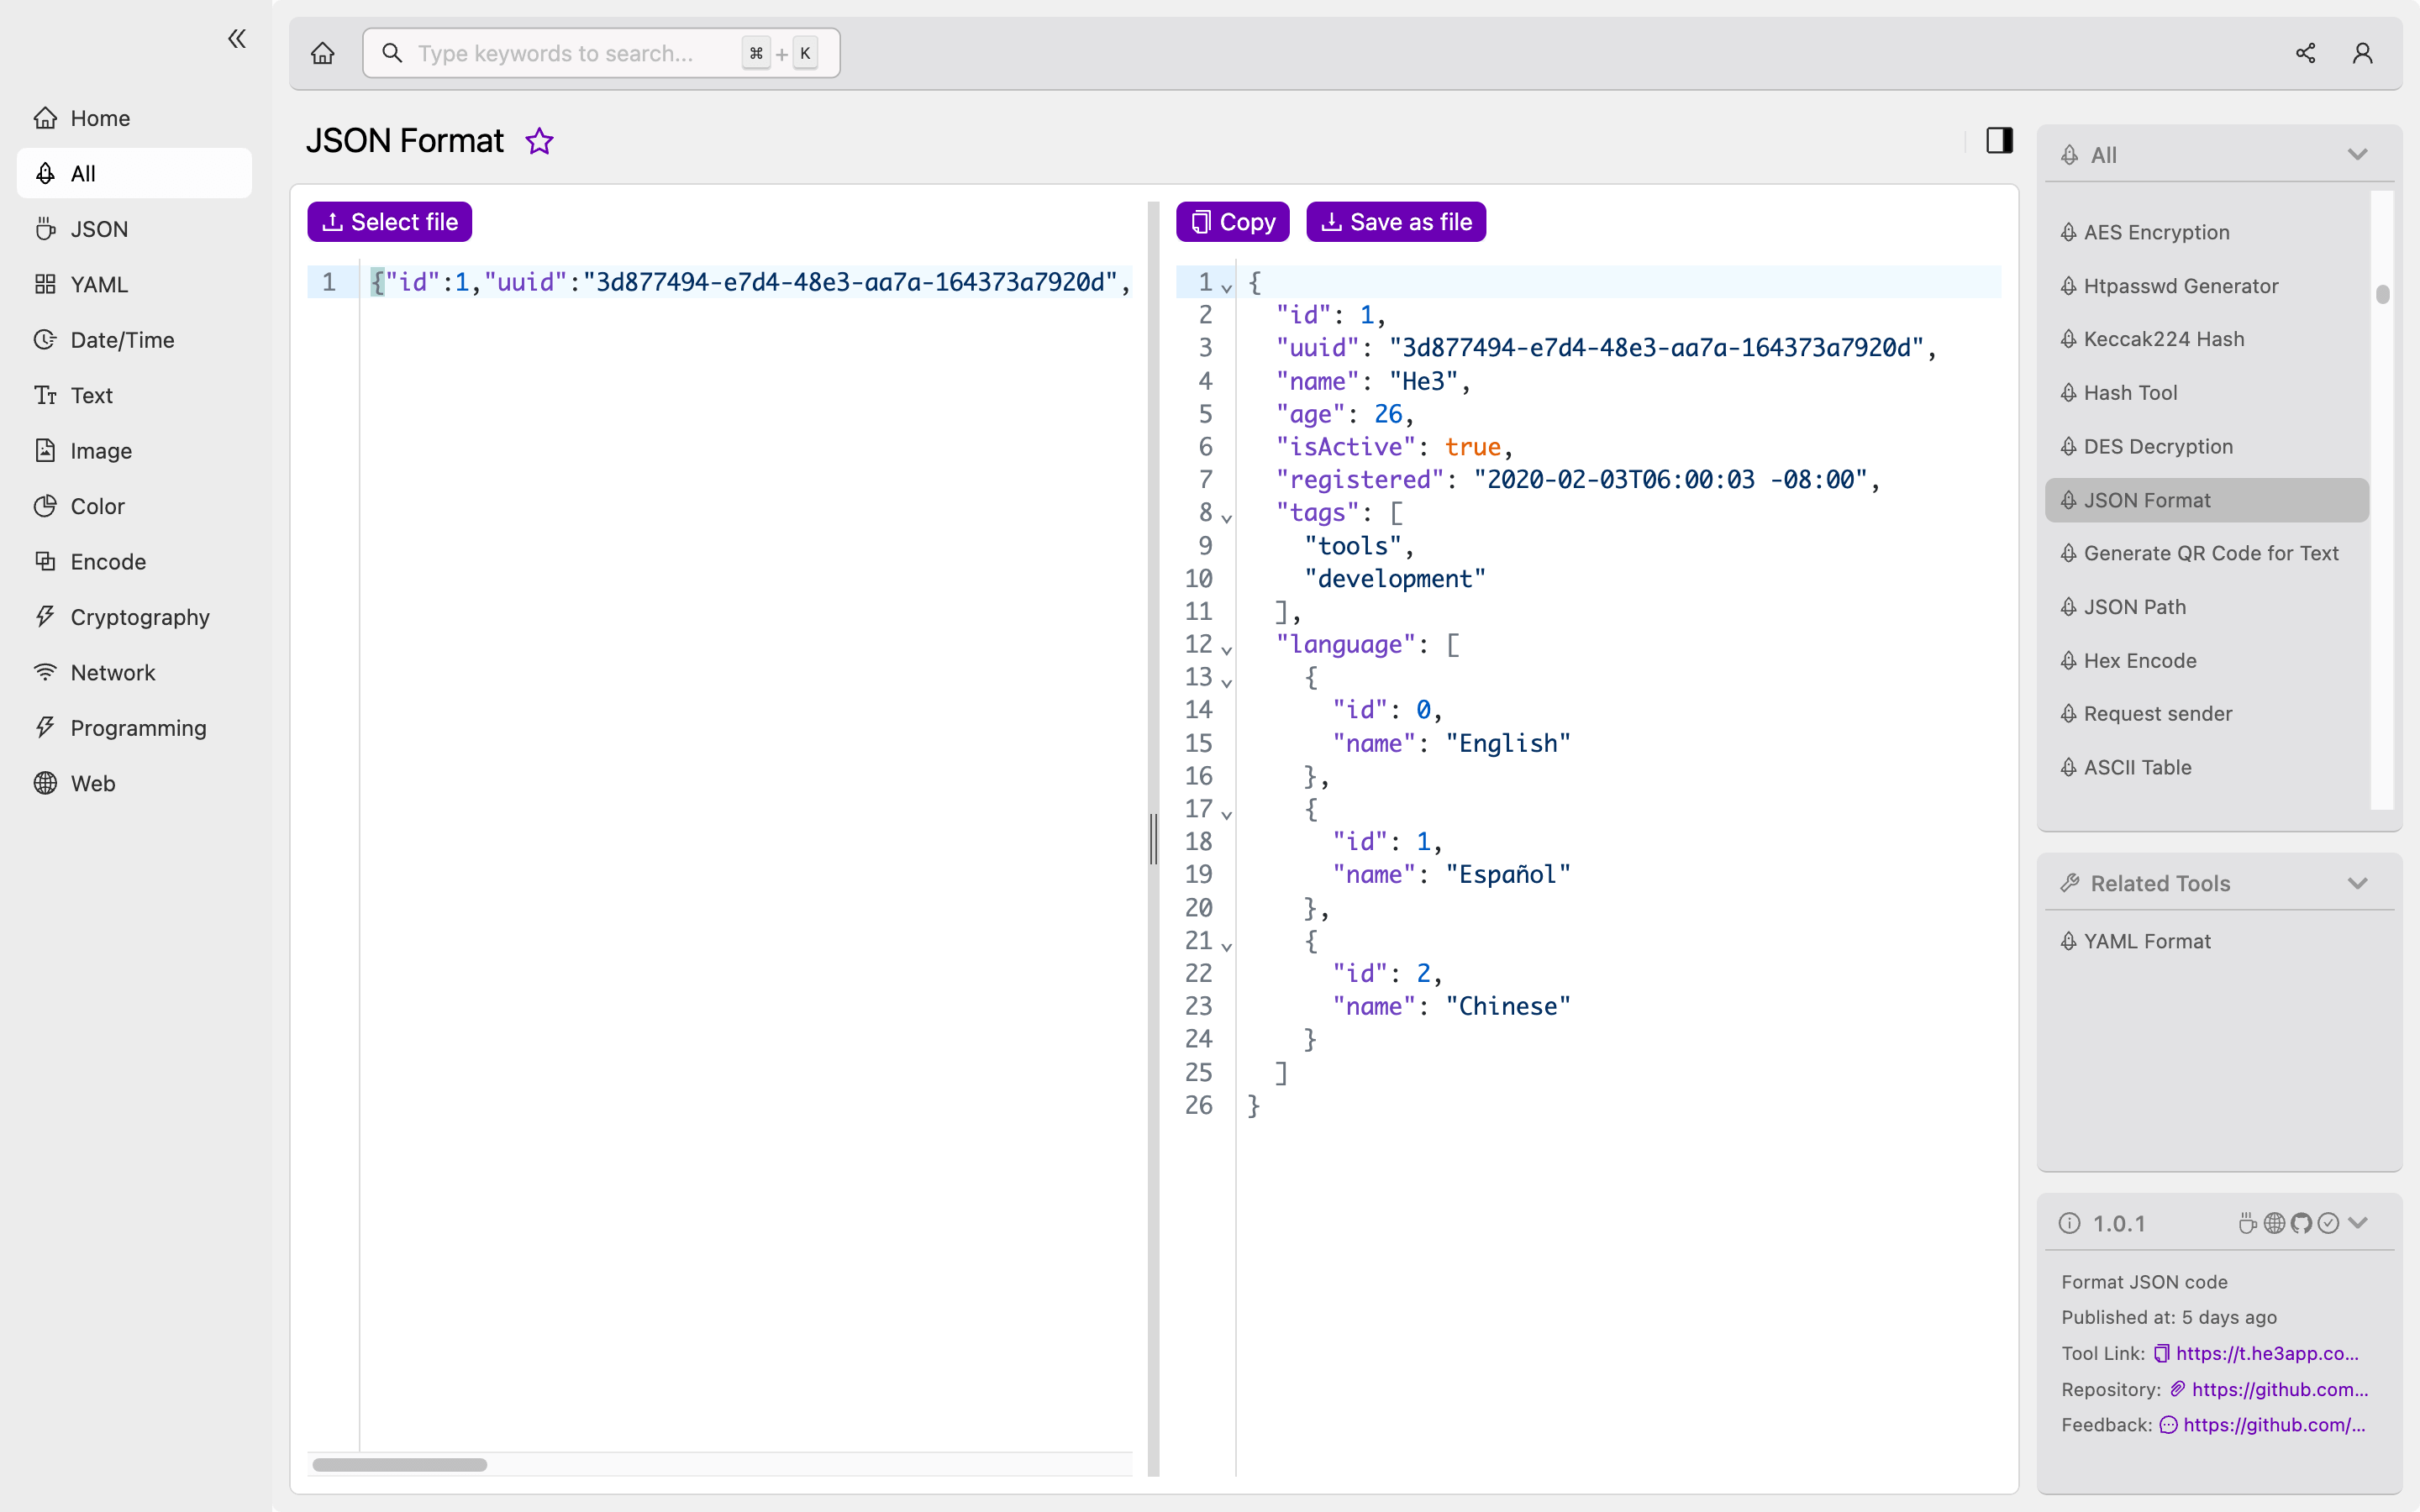
Using He3 Toolbox to Debug JSON Code
One of the best tools for debugging JSON code is the He3 Toolbox. With this tool, you can easily validate, parse, and read JSON code. He3 Toolbox provides easy-to-understand error messages and allows you to visualize the JSON data in a structured format.
To use the He3 Toolbox for debugging JSON code, simply input your code into the tool and click the “Debug” button. The tool will check your code for any syntax errors and provide you with a list of issues that need to be addressed.
Misconceptions and FAQs
Here are some common misconceptions about debugging JSON code:
- Myth: JSON debugging is too complicated for beginners. Truth: With the right tools and techniques, anyone can debug JSON code.
- Myth: JSON debugging is only necessary when working with large amounts of data. Truth: JSON errors can occur at any scale and can cause issues regardless of data size.
Here are some frequently asked questions about debugging JSON code:
- Q: What is the most common error in JSON code? A: The most common error in JSON code is a Syntax Error.
- Q: What is the best tool for debugging JSON code? A: There are many tools available for debugging JSON code, including He3 Toolbox, JSONLint, and JSON Formatter & Validator.
Conclusion
Debugging JSON code is an essential skill for developers, as it allows you to identify and fix errors in your data exchange. By using the right tools and techniques, you can make your debugging process more efficient and effective. Remember to use He3 Toolbox to make debugging your JSON code a breeze!

